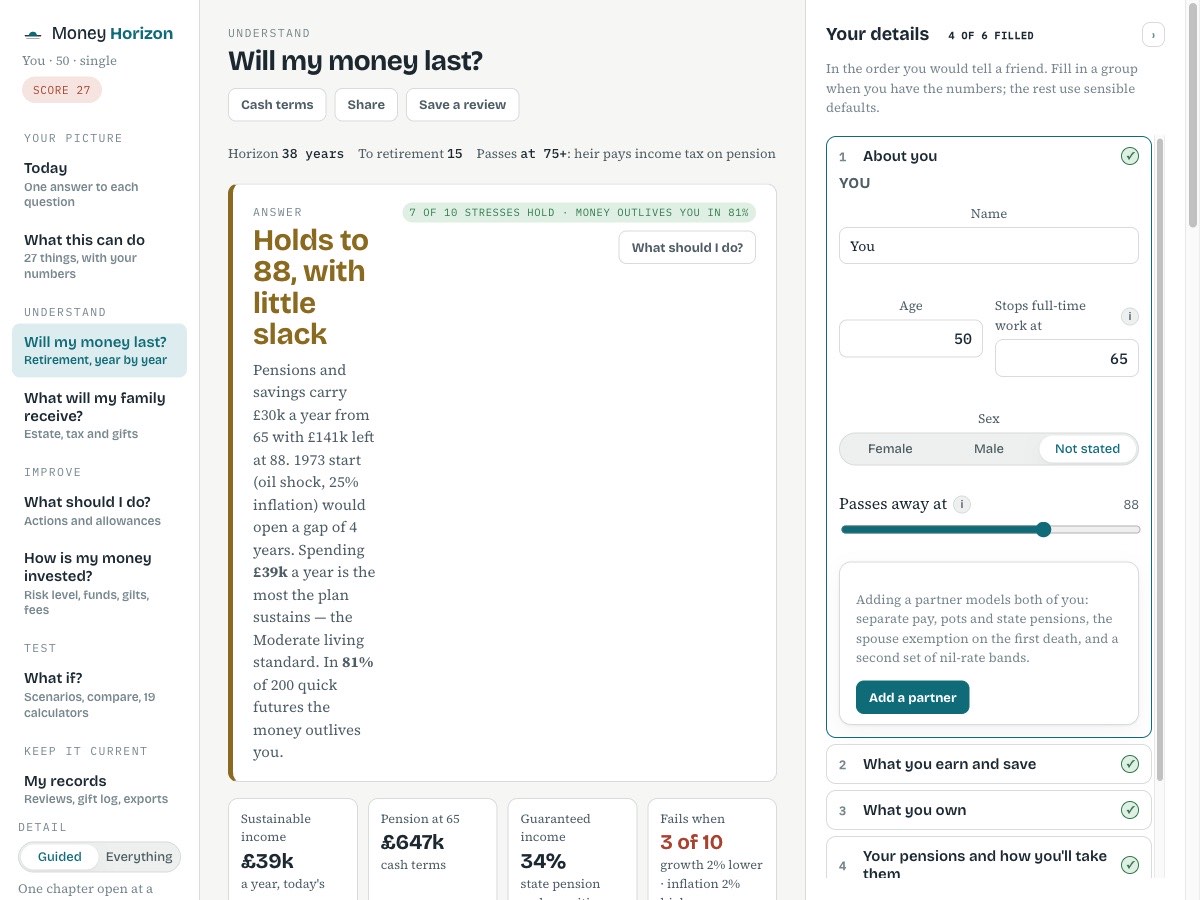
One answer, then the reasons: whether your pensions and savings carry the income you want to the age you plan for, what it would take to break the plan, and what would fix it. Every chart is real UK history or your own figures, never a rule of thumb.
Money Horizon › Understand
Understand
Will my money last?
Chapters on this page
1
Income year by year
Where each year's income comes from against what the year costs, how it splits between pensions, ISAs and cash, where it is taxed, and this year's tax thresholds.
2
The stress tests
Ten bad-luck cases — a poor first decade, 1973, 2000 and 2008 replays, care costs, lower growth, living to 100, a mortgage rate 3 points higher — plus the chance the money outlives you from hundreds of resampled futures.
3
Retiring earlier or later
What each year does to the income the plan sustains, and the earliest age that still holds.
4
Which order and rule to draw the money
Pension, ISA, cash in each order and what it costs in tax; four spending rules compared; a cash bucket and guardrails.
5
Pension contributions and allowances
Contributions against the annual allowance, the taper and carry-forward.
6
Reaching a pot goal
What to save to hit a pot at an age, and where an extra £1,000 a year does most.
7
The plan on one line
Work, the state pension, the mortgage ending, care and every one-off event on a single age axis.
8
Floor and upside
The essential part of spending against income that never depends on markets — state pension, final-salary pensions, annuities — year by year; what bridges the years before the state pension, and what an annuity covering a lasting gap would cost.
Related
Not advice. Money Horizon is a planning indicator built on simplified rules. It does not know your full circumstances, cannot replace a regulated adviser, and its figures should not be relied on for any decision. It is not financial advice. Nothing you enter leaves your browser.